Discuss issues and ideas you have to configuring displays with PowerVision
-
ronaldbroth
- Posts: 15
- Joined: Wed Jun 14, 2017 12:45 pm
Post
by ronaldbroth » Tue Nov 28, 2017 10:31 am
Graph Widget question:
Can I programmatically (via Script) change the min/max limits for the graph widget? This would help my application as depending on the setup -- the limits for displaying pressure (as an example) could be 0-1000 psig, 0-2000 psig, 0-3000 psig, etc.
Being able to change the number of data points via Script may also be useful (not sure about this yet as I have not gotten to that point).
Here is the graph widget config parameter box. Hope the answer is yes.
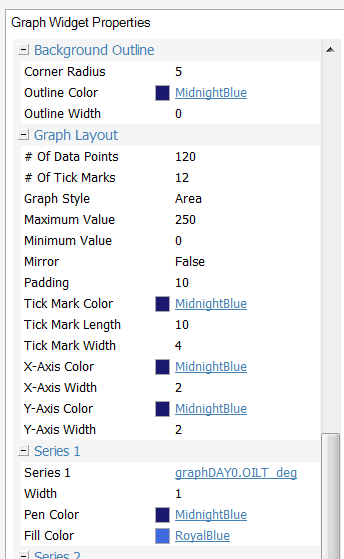
- 11-28-2017 10-22-48.png (23.05 KiB) Viewed 78 times
Ron Roth, Ph.D.
EControls, LLC
-
boyce
- Enovation Controls Development

- Posts: 322
- Joined: Wed Sep 08, 2010 5:09 pm
Post
by boyce » Tue Nov 28, 2017 12:52 pm
Sorry, but no the graph parameters are not changeable. But since there are only 3 ranges you might consider 3 stacked graph widgets and only show the widget with the desired range and hide the others. Hopefully the number of data points will not be a problem.
Boyce Schrack
Enovation Controls
-
ronaldbroth
- Posts: 15
- Joined: Wed Jun 14, 2017 12:45 pm
Post
by ronaldbroth » Wed Nov 29, 2017 12:57 pm
Thanks for the clarification.
Ron